Introduction
Candlestick charts are a popular tool used in technical analysis to study and predict price movements in financial markets. By understanding the patterns and signals these charts provide, investors can make informed decisions about buying or selling assets. In this article, we will explore the art of reading candlestick charts, delve into their history and components, and discuss how to interpret the patterns they present.
What are Candlestick Charts?
Candlestick charts originated in Japan in the 18th century and were used to analyze the price fluctuations of rice contracts. Today, they are widely used in various financial markets, such as stocks, commodities, and forex. Candlestick charts visually represent price movements over a specified time period. Each individual candlestick represents a specific time frame and contains valuable information about the opening, closing, high, and low prices of an asset.
Components of a Candlestick
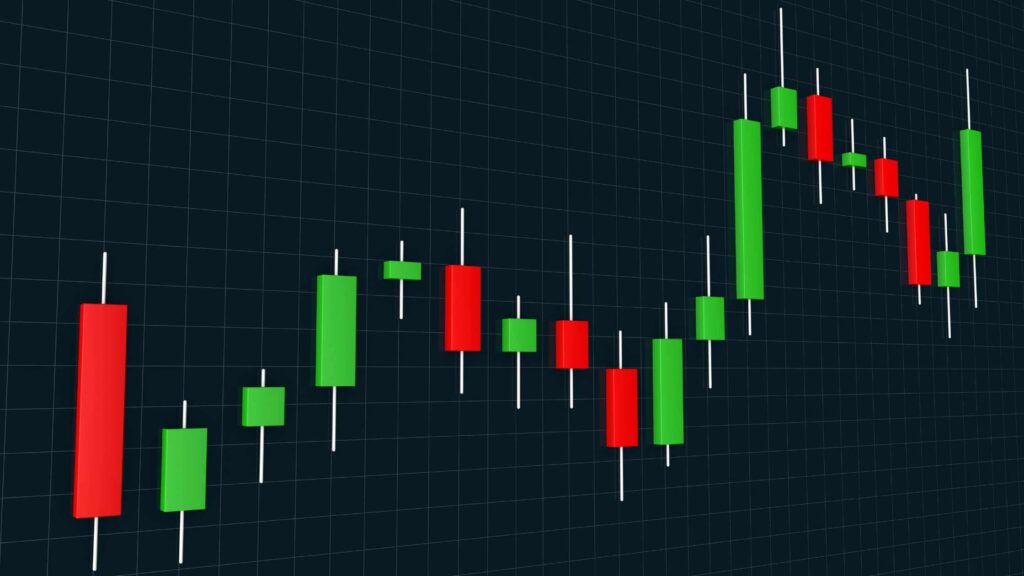
A candlestick consists of two main parts: the body and the wick or shadow. The body represents the price range between the opening and closing prices. If the closing price is higher than the opening price, the body is usually filled or colored green. Conversely, if the opening price is higher than the closing price, the body is typically empty or colored red. The wick or shadow represents the high and low prices during the designated time frame.
Popular Candlestick Patterns
Candlestick charts display a variety of patterns that can indicate potential trend reversals, continuation patterns, or indecision in the market. Here are a few popular candlestick patterns to be aware of:
1. Doji
A doji is formed when the opening and closing prices are nearly the same, resulting in a small or non-existent body. It suggests market indecision and could signal a possible trend reversal.
2. Hammer and Hanging Man
Both the hammer and hanging man patterns have a small body and a long lower wick. The difference lies in their context. A hammer occurs during a downtrend and indicates a potential bullish reversal. Conversely, a hanging man appears during an uptrend and suggests a bearish reversal might occur.
3. Bullish and Bearish Engulfing
The bullish engulfing pattern occurs when a small bearish candle is followed by a larger bullish candle that engulfs it entirely. This indicates a potential trend reversal towards the upside. In contrast, the bearish engulfing pattern consists of a small bullish candle followed by a larger bearish candle, signaling a potential downward trend reversal.
4. Morning and Evening Stars
The morning star pattern occurs during a downtrend and consists of three candles: a bearish candle, a small doji or spinning top, and a bullish candle. It suggests a potential trend reversal towards the upside. The evening star pattern is the opposite, occurring during an uptrend and pointing towards a potential reversal to the downside.
Reading Candlestick Patterns
To effectively read candlestick patterns, it is crucial to consider them in the context of the overall market conditions. One must analyze factors such as volume, support and resistance levels, and other technical indicators to validate the signals provided by the patterns. Additionally, it is important to combine candlestick analysis with other forms of technical analysis for a comprehensive understanding of the market trends.
Conclusion
Candlestick charts provide valuable insights into market trends and can greatly assist investors in making informed decisions. By understanding the art of reading candlestick charts and recognizing the patterns and signals they present, investors can increase their chances of success in the financial markets. Familiarity with candlestick analysis, along with other technical analysis tools, is essential for any trader or investor seeking to navigate the complexities of the financial markets.